Satellite
UAH / RSS
Microwave sounding of the lower troposphere since late 1978. Nearly global, including oceans. Sensitive to diurnal-drift and weighting-function choices — hence two groups, two curves.
Updated through 2026
Category · temperature
Satellite troposphere (UAH, RSS) and surface blends (HadCRUT5, GISTEMP) are different instruments. Since 1979 every product warms, and they do not warm at the same rate. Put them on one pane and change the zero yourself.
UAH v6.1 TLT · RSS TLT v4 · HadCRUT5 · GISTEMP v4
Same files as the overlay above. 13-month means, 1991–2020 baseline, 1979–2025 overlap.
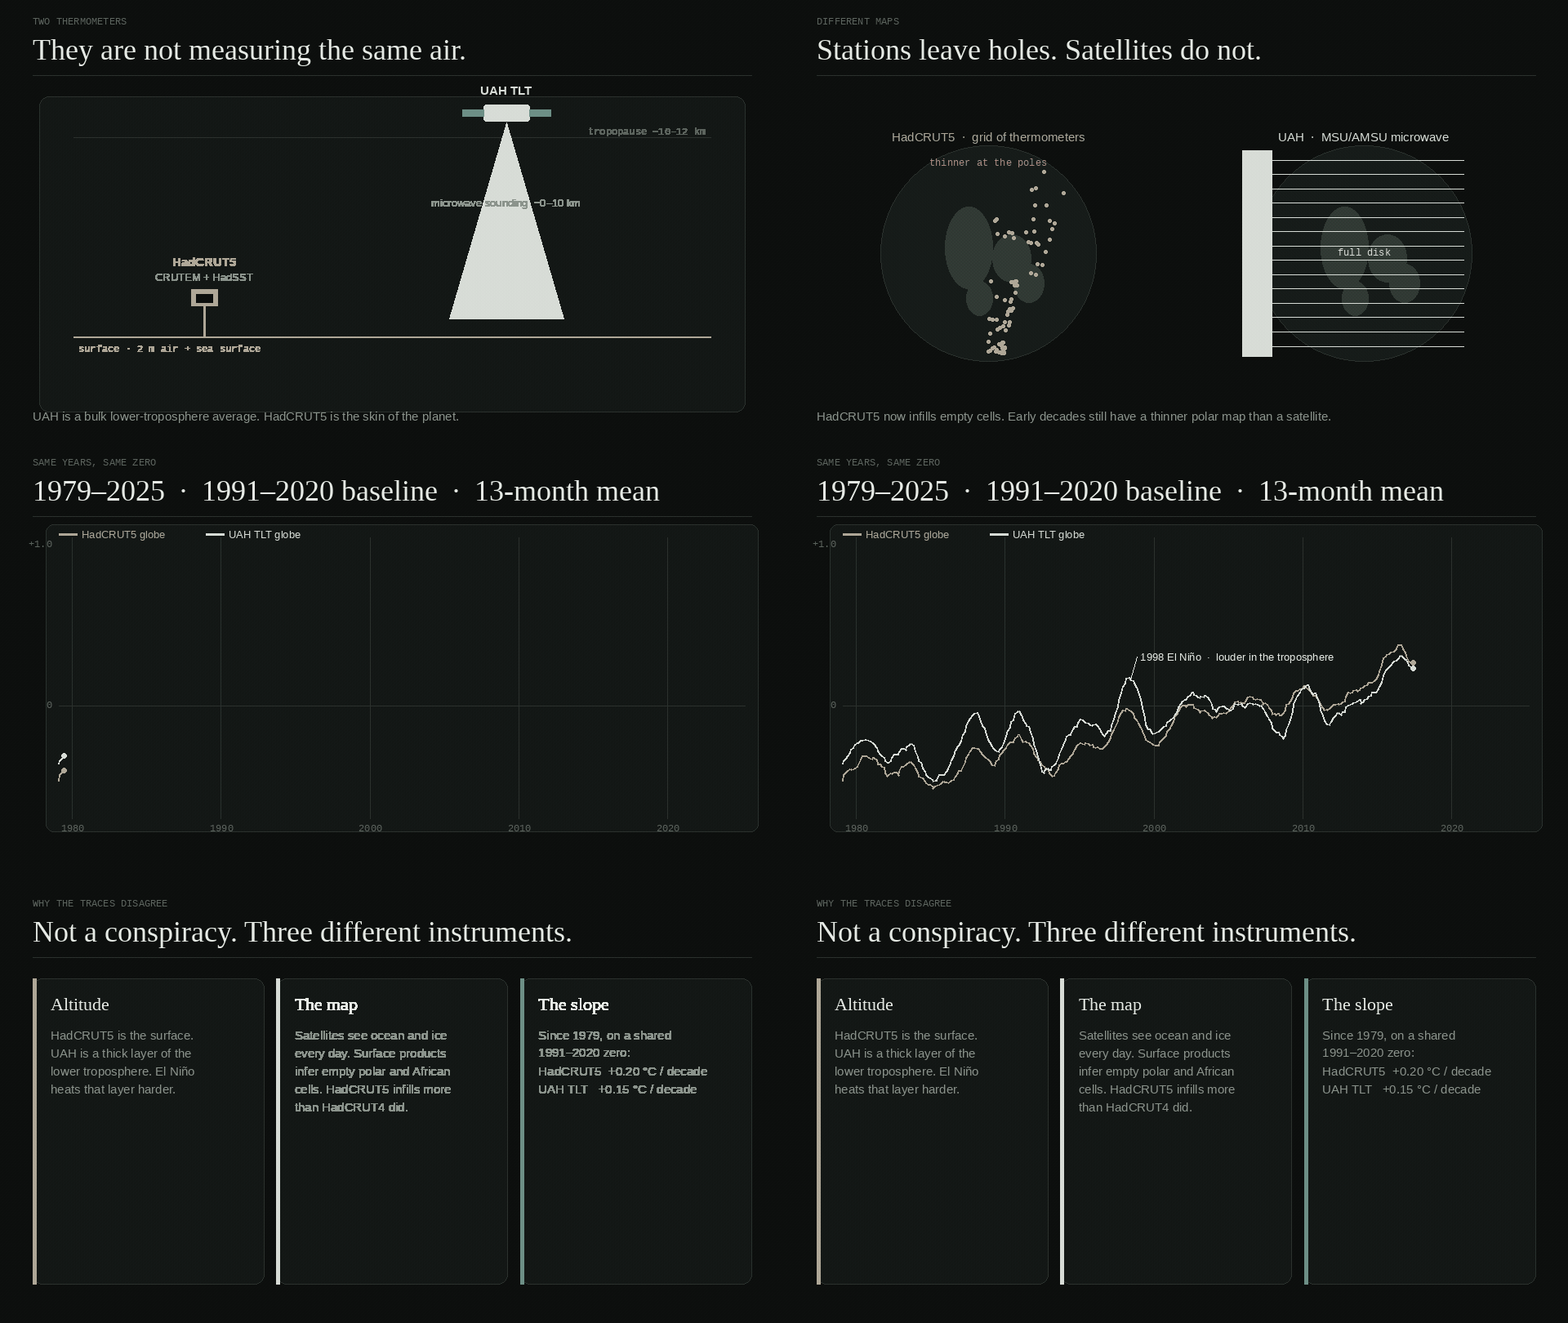
They are both global temperature, and they are not interchangeable. UAH is a microwave average of the lower troposphere; HadCRUT5 is 2-metre air over land plus sea-surface temperature. El Niño rings louder aloft. Surface products have to invent values where stations are missing. On the overlapping years the surface has warmed a little faster (~0.20 °C/decade) than UAH TLT (~0.15 °C/decade).
Satellite
Microwave sounding of the lower troposphere since late 1978. Nearly global, including oceans. Sensitive to diurnal-drift and weighting-function choices — hence two groups, two curves.
Surface blend
Blend of CRUTEM stations and HadSST, from 1850. Sparse polar and African coverage in early decades. Lighter infilling than GISTEMP.
Interpolated surface
NASA’s land–ocean index. Extrapolates into data-poor cells. Tends to run warmer than UAH after 2000. NOAAGlobalTemp tracks it closely.
Companion desks
They are not extra series on these charts — they are the arguments about ice versus stomata, the 20th-century blade, the ¹³C fingerprint, the 1988 polar forecasts, and what CERES actually attributes the last 26 years to.
Plant leaves keep a growing-season count of pores. Antarctic ice keeps bubbles of old air. Ice-core CO₂ is heavily smoothed; stomatal series still carry century-scale swings that only meet the ice at the instrumental splice.
Open the desk
Mann, Bradley & Hughes 1998 made a shaft-and-blade by overweighting the Sheep Mountain bristlecone (CA534) by as much as 390×. Strip that weight and the 1910–1938 climb is already there. Drag the weight yourself against HadCRUT5.
Open the desk
The “fossil isotopic signature” is not a raw intercept. Station Keeling plots sit near −13‰; the textbook −28‰ is an isoflux term after gravity, diffusion, blank and scale corrections. The ledger separates observation from the model step.
Open the desk
1988-era scenarios warmed both poles under well-mixed greenhouse gas. The split is not that: Arctic air rose; Antarctic did not. Sea-level rise since 1900 is expansion-scale, not a melt pulse matching those polar-ice forecasts.
Open the desk
Nikolov & Zeller and Goessling, Rackow & Jung land on the same CERES fact: the last ~26 years of warming track absorbed sunlight from a falling planetary albedo. They split on story; the satellite number they both use is albedo, not CO₂ forcing.
Open the desk